Inverted Hammer Pattern: A Simple Guide to Smart Trading
Have you ever looked at a stock chart and wondered why a tiny candle with a long shadow can make traders so excited? That’s the magic of the inverted hammer pattern — one of the simplest yet most powerful candlestick formations used in trading.
In this guide, we’ll break down its meaning, formation, and how you can use it to make smarter trading decisions. We’ll also explore inverted hammer in uptrend setups and even connect you with trading courses in Bangalore to master the art of technical analysis.
Learn how the inverted hammer pattern, especially the inverted hammer in uptrend, signals trading opportunities. Also find top trading courses in Bangalore.
Understanding the Inverted Hammer Pattern
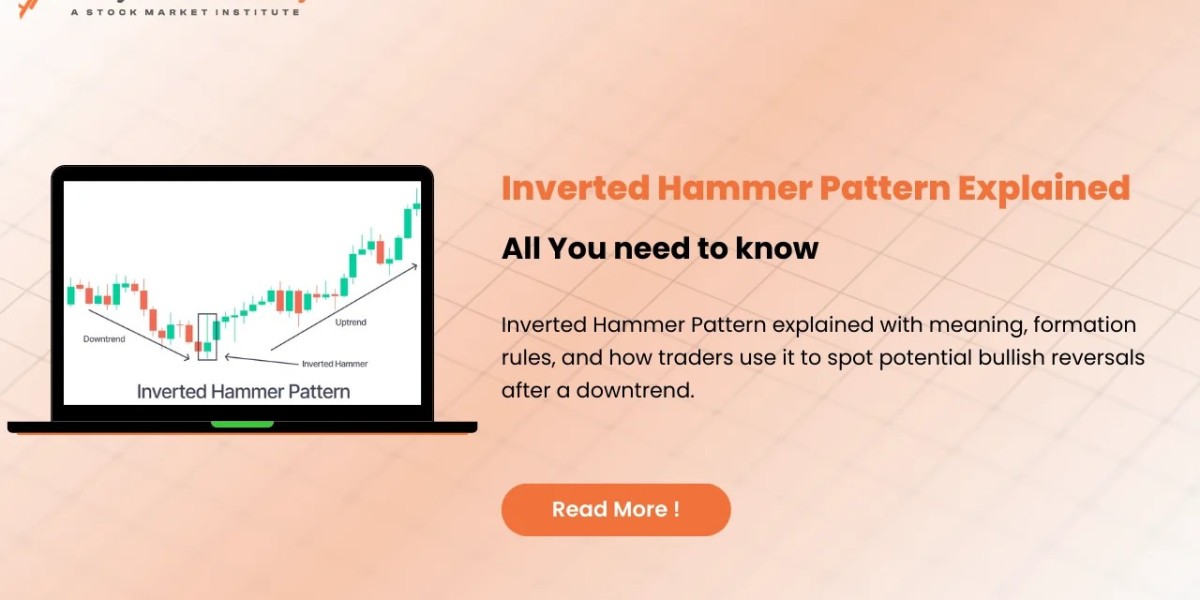
The inverted hammer pattern is a single-candle reversal pattern that typically appears at the bottom of a downtrend. It signals that buyers are starting to push back against sellers — a possible hint that prices may soon rise.
Think of it like a tug of war where sellers have been pulling hard for days. Suddenly, buyers start pulling back, giving a glimpse of strength. The inverted hammer tells you buyers might regain control soon.
Anatomy of the Inverted Hammer Candle
An inverted hammer has a distinct look:
A small real body (either green or red).
A long upper shadow (at least twice the body height).
A tiny or no lower shadow.
This formation resembles an upside-down hammer — hence the name. The upper wick represents the failed attempt of buyers to maintain higher prices during that period, followed by a close near the open, suggesting a potential shift in momentum.
Difference Between Inverted Hammer and Shooting Star
Both patterns look similar, but their positions make all the difference:
Pattern | Appears In | Market Signal |
Inverted Hammer | At the end of a downtrend | Bullish reversal |
Shooting Star | At the end of an uptrend | Bearish reversal |
So, if you spot a candle with a long upper wick after a strong downtrend — it’s a bullish inverted hammer.
Psychology Behind the Pattern
Every candlestick tells a story of buyer and seller emotions.
In the case of the inverted hammer, the story goes like this:
Sellers initially control the market.
Buyers fight back and push prices higher.
Sellers re-enter but fail to bring prices to new lows.
This shows that buying pressure is starting to build, hinting that the trend might soon reverse.
What Does the Inverted Hammer Indicate?
When you see an inverted hammer after a long fall, it’s like seeing the first spark after heavy rain — a possible sign of revival.
However, alone it’s not enough. You’ll need confirmation — such as the next candle closing strongly above the inverted hammer’s high — to confirm the reversal.
Identifying the Pattern in Charts
To correctly identify an inverted hammer:
Check for it after a downtrend.
Look for a small body with a long upper wick.
Ensure the upper shadow is at least twice the body height.
The lower shadow should be very short or absent.
Many charting platforms like TradingView, MetaTrader, or ThinkorSwim make spotting these patterns easy with built-in candlestick scanners.
How the Inverted Hammer in Uptrend Works
Yes, an inverted hammer in uptrend can appear too — but its meaning flips.
When it appears during an uptrend, it acts more like a warning than a signal. It indicates that even though buyers pushed prices high, sellers entered aggressively to pull it back down.
In such a case, it may hint at a potential slowdown or a trend exhaustion rather than a reversal.
How to Trade Using the Inverted Hammer Pattern
Here’s a simple approach:
Spot the Candle: Look for an inverted hammer at the bottom of a downtrend.
Wait for Confirmation: The next candle should close above the high of the inverted hammer.
Enter the Trade: Consider entering at or slightly above that confirmation candle.
Set Stop-Loss: Place a stop-loss just below the low of the inverted hammer.
Take Profit: Aim for a 1:2 or 1:3 risk–reward ratio.
This strategy suits swing traders and short-term investors who rely on chart patterns and price action.
Confirmation Signals You Shouldn’t Ignore
Always confirm before you act. Some common confirmation methods include:
A bullish candle forming right after the inverted hammer.
An increase in trading volume.
RSI bouncing from the oversold zone.
MACD crossover showing upward momentum.
These help validate the candle’s bullish promise and protect you from false signals.
Common Mistakes Traders Make
Even experienced traders can misread this pattern. Beware of these pitfalls:
Forcing patterns where none exist.
Trading without volume confirmation.
Forgetting to analyze the overall trend.
Ignoring risk management.
Remember, even the strongest signals can fail. The key is to pair patterns with a well-defined trading plan.
Combining It with Other Trading Indicators
To enhance accuracy, combine the inverted hammer with:
Moving averages: To identify long-term trend direction.
Support and resistance levels: Confirm reversal zones.
Fibonacci retracement: Measure correction strength.
Volume indicators: Filter out weak signals.
When multiple factors line up with an inverted hammer, your trade has a much better chance of success.
Real-Life Examples of the Inverted Hammer
Let’s take an example:
During a market dip, a stock like Tata Motors formed an inverted hammer on its daily chart after multiple red candles. The next day, a strong bullish candle appeared — confirming reversal. Over the following week, the price rallied by over 5%.
This shows the importance of combining pattern recognition with confirmation.
Best Trading Courses in Bangalore
If you’re serious about learning these patterns, Bangalore is a hub of trading education. Some reputed trading courses in Bangalore include:
Trendy Traders Academy: Offers hands-on market training with a focus on candlestick and algo trading.
Zerodha Varsity workshops: A great free resource for beginners.
FinOptions Institute: Provides NSE-certified technical analysis programs.
QuantInsti EPAT: Focuses on algorithmic and quantitative trading for advanced learners.
Each of these institutions can help you build a strong technical foundation to recognize and act on signals like the inverted hammer pattern effectively.
Why Learn Candlestick Patterns Professionally
Learning from experts saves time and prevents costly errors. Courses on trading psychology, risk management, and chart analysis teach how to:
Spot high-probability setups.
Avoid emotional trading.
Develop a disciplined approach to markets.
Candlestick mastery isn’t about memorizing shapes — it’s about understanding price behavior.
Final Thoughts and Practical Takeaways
The inverted hammer pattern may look simple, but its implications are deep. It captures a turning moment when buyers begin to reclaim control.
However, always combine it with confirmations and risk management. Like any trading tool, its success lies in how wisely you use it, not how often you spot it.
Whether you’re a beginner learning through trading courses in Bangalore or a self-taught trader, understanding patterns like the inverted hammer in uptrend or reversal setups can sharpen your market edge.
Frequently Asked Questions (FAQs)
1. What is the inverted hammer pattern?
The inverted hammer is a single-candle bullish reversal pattern that forms after a downtrend, signaling potential upward movement.
2. How is it different from a shooting star?
An inverted hammer appears at the end of a downtrend (bullish), while a shooting star shows up at the end of an uptrend (bearish).
3. Can the inverted hammer appear in an uptrend?
Yes, but in such cases, it often signals trend exhaustion or hesitation, not reversal.
4. Is it safe to trade only based on this pattern?
No. Always confirm with volume, trend indicators, or next candle movement before entering a trade.
5. Where can I learn more about candlestick patterns?
Some top-rated trading courses in Bangalore and online platforms like Zerodha Varsity or Trendy Traders Academy offer detailed training on these chart patterns.