Doji Candlestick Pattern: The Trader’s Secret Language of Market Psychology
Have you ever looked at a stock chart and felt like it was trying to tell you something — but you didn’t quite understand its language? Well, the doji candlestick pattern is one of those quiet whispers from the market that experienced traders know how to interpret. It’s like a pause, a moment of hesitation, when buyers and sellers stand face-to-face, deciding who will take the next move.
In this guide, we’re going to simplify everything about the doji candle pattern — what it means, how to spot it, and how you can use it in your own trading. Whether you’re a beginner learning through the best trading courses or a self-taught trader trying to improve your chart-reading skills, this article will make you confident the next time a doji appears on your screen.
Learn the doji candlestick pattern, doji candle pattern meaning, and how to read it for trading. Discover tips, examples, and best trading courses.
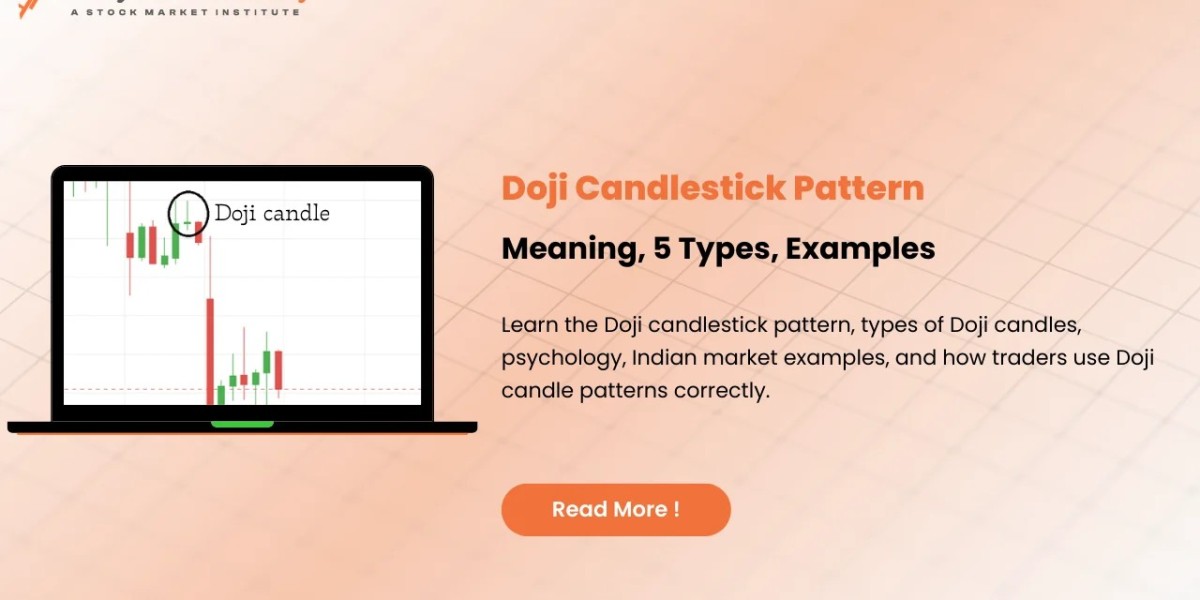
What is a Doji Candlestick Pattern?
A doji candlestick pattern is a type of candlestick that forms when a market’s opening and closing prices are almost the same. This tiny body means indecision — neither buyers nor sellers won the battle during that time frame.
Think of a doji like the calm before a storm. It doesn’t tell you which way the price will go, but it does tell you that a big decision might be coming soon.
The Psychology Behind the Doji Candle Pattern
Each candlestick tells a story. The doji candle pattern tells us that both bulls (buyers) and bears (sellers) fought equally, and neither side dominated. It’s a moment of market uncertainty, signaling potential reversal or continuation, depending on where it forms.
In emotional terms, imagine two teams tugging a rope — after hours of pulling, the rope barely moves. That’s exactly what a doji describes in the chart — tension building in both directions.
Types of Doji Candlestick Patterns
There isn’t just one kind of doji. Depending on how long the wicks (shadows) are and where the open/close lie, you can spot several types:
Standard Doji: The cross-like symbol, showing nearly equal open and close.
Long-Legged Doji: Long upper and lower shadows — lots of volatility but no decision.
Dragonfly Doji: Looks like a “T,” shows buyers stepped in strongly after sellers tried to push prices down.
Gravestone Doji: Looks like an inverted “T,” indicates sellers returning after buyers pushed prices up.
Each has its unique message when it appears in an uptrend or a downtrend.
Common Variations: Long-Legged, Dragonfly, and Gravestone
Let’s explore these doji variations a bit deeper:
Long-Legged Doji – The market was very active, with wide swings up and down, but ended roughly where it started. It’s a sign of heavy indecision.
Dragonfly Doji – Buyers refuse to let the price stay low, pushing it back up by the close. When this appears after a downtrend, it can signal a bullish reversal.
Gravestone Doji – Sellers overpower buyers after a rally. Found after an uptrend, this could point to an upcoming bearish shift.
Each shape carries a unique story, and learning these helps you interpret charts like a fluent trader.
How to Identify a Doji Candle Pattern
Spotting a doji is quite easy once you know what to look for:
The open and close prices are almost identical.
The candle body is very narrow (thin line).
The wicks or shadows can be long or short based on market movement.
Pro tip: Use candlestick chart settings, not line charts, to clearly visualize these patterns.
What a Doji Means in an Uptrend
When a doji forms during an uptrend, it suggests that the bullish momentum may be losing steam. The buyers, who have been in control, are starting to hesitate — and sellers might be preparing to take over.
However, one doji alone doesn’t confirm a reversal. Traders look for confirmation candles — like a bearish candle after the doji — before taking action.
What a Doji Means in a Downtrend
In a downtrend, a doji can be a glimmer of hope for bulls. It shows selling pressure may be fading, and a reversal could be near. If a strong bullish candle follows the doji, it often confirms the start of an upward move.
In other words, a doji in a downtrend is like seeing the first ray of sunlight after a long storm — possible, but you still need to check the forecast.
How Traders Use Doji Patterns for Entries and Exits
Traders don’t use the doji candlestick pattern in isolation. It becomes powerful when matched with trendlines, support/resistance levels, or volume analysis.
Common strategies include:
Reversal Entry: Wait for a dhttps://trendytraders.in/doji-candlestick-pattern/oji near strong support/resistance and enter after confirmation.
Stop-Loss Placement: Below the low (for bullish setups) or above the high (for bearish setups).
Exit Signals: If a doji appears near your profit target, it may suggest to lock profits as the trend might pause or reverse.
Common Mistakes Traders Make with Doji Patterns
Even seasoned traders slip up sometimes. The most frequent mistakes include:
Relying on a single doji without confirmation.
Ignoring overall market trends and context.
Misinterpreting small-bodied candles as dojis.
Trading every doji as a reversal signal.
Avoid these by remembering one rule — a doji suggests indecision, not guarantees it.
Combining Doji Patterns with Technical Indicators
Indicators can add more reliability to your doji interpretations:
Relative Strength Index (RSI): Confirms overbought/oversold zones.
Moving Averages (MA): Help identify the trend direction.
Volume Analysis: High volume around a doji increases its validity.
By aligning doji signals with your favorite indicators, your entries can become sharper and smarter.
Real Chart Examples of Doji Candles
When analyzing price charts on platforms like TradingView, you’ll often find dojis appear before major shifts.
For example:
A dragonfly doji after a long decline in Nifty or NASDAQ charts often hints at a bounce.
A gravestone doji after a rally suggests exhaustion — like traders pausing at the top of a mountain before heading down.
Practice visualizing these setups, and soon identifying dojis will become intuitive.
The Best Trading Courses to Learn Candle Patterns
If you’re serious about learning chart patterns like the doji candle pattern, structured education is a game-changer. Here are a few best trading courses to consider:
Trendy Traders Academy: Focuses on candlestick-based price action trading.
Quanttrix Trading Mastery Course: Great for algorithmic backtesting and practical chart reading.
TradingView Education Center: Free tutorials for beginners on pattern reading.
Coursera Technical Analysis Specialization: Offers theory plus interactive assignments.
Remember, courses work best when you apply what you learn on real or demo accounts.
Doji vs. Spinning Top: What’s the Difference?
Many beginners confuse dojis with spinning tops. They look similar, but there’s a key distinction:
Doji: Opening and closing prices are nearly identical — pure indecision.
Spinning Top: Has a small body — meaning slight price difference between open and close — but still uncertainty.
In short, every doji is a sign of hesitation, but not every spinning top qualifies as a true doji.
How to Backtest the Doji Strategy for Better Confidence
Before risking real money, traders often backtest — test the pattern on historical charts.
Steps to do it:
Choose a charting platform (e.g., TradingView, MetaTrader).
Identify doji patterns using visual scan or indicators.
Note outcomes when they appear after trends or at key price zones.
Record success rates and tweak your approach.
This helps you filter out false signals and gain confidence in your strategy.
Final Thoughts on Doji Candlestick Mastery
The doji candlestick pattern might look small, but its message is powerful. It’s a reminder that markets breathe, pause, and think — just like us. Learning to interpret that hesitation allows you to sense potential reversals before they happen.
Like reading emotions from a friend’s expressions, chart reading through patterns like the doji candle pattern helps you understand the market’s mood. Study it, test it, and it might soon become one of your most trusted trading indicators.
Frequently Asked Questions (FAQs)
1. What is the main purpose of a doji candlestick pattern?
A doji represents indecision in the market — it shows that buyers and sellers are equally matched, often hinting at a possible change in trend.
2. Can the doji candlestick pattern predict exact reversals?
No, it signals potential reversals, but confirmation from the next few candles or additional indicators is essential.
3. Is a dragonfly doji bullish or bearish?
A dragonfly doji is generally seen as bullish, especially if formed after a downtrend, showing strong buyer comeback.
4. Which time frame is best for spotting dojis?
The pattern works on any time frame — from 1-minute to daily charts — but reliability improves with longer intervals like 4-hour or daily charts.
5. Can beginners learn candle patterns in the best trading courses?
Absolutely. Many best trading courses simplify visual learning with examples, quizzes, and live chart sessions to help you master the doji and other patterns.